Software
ClearSpend
See everything. Scroll nothing.
Mint died. YNAB costs $100/year. Every finance app either locks your data in their cloud or drowns you in tabs and scroll. ClearSpend is a local-first dashboard that renders every linked account, transaction, and budget category in a single viewport — no scrolling, no cloud sync, no subscription. Three interlocking D3 visualizations replace the spreadsheet: a proportional burn ring for category spend, a pulse strip for budget warnings, and a treemap for subcategory drill-down. Data stays on the machine.
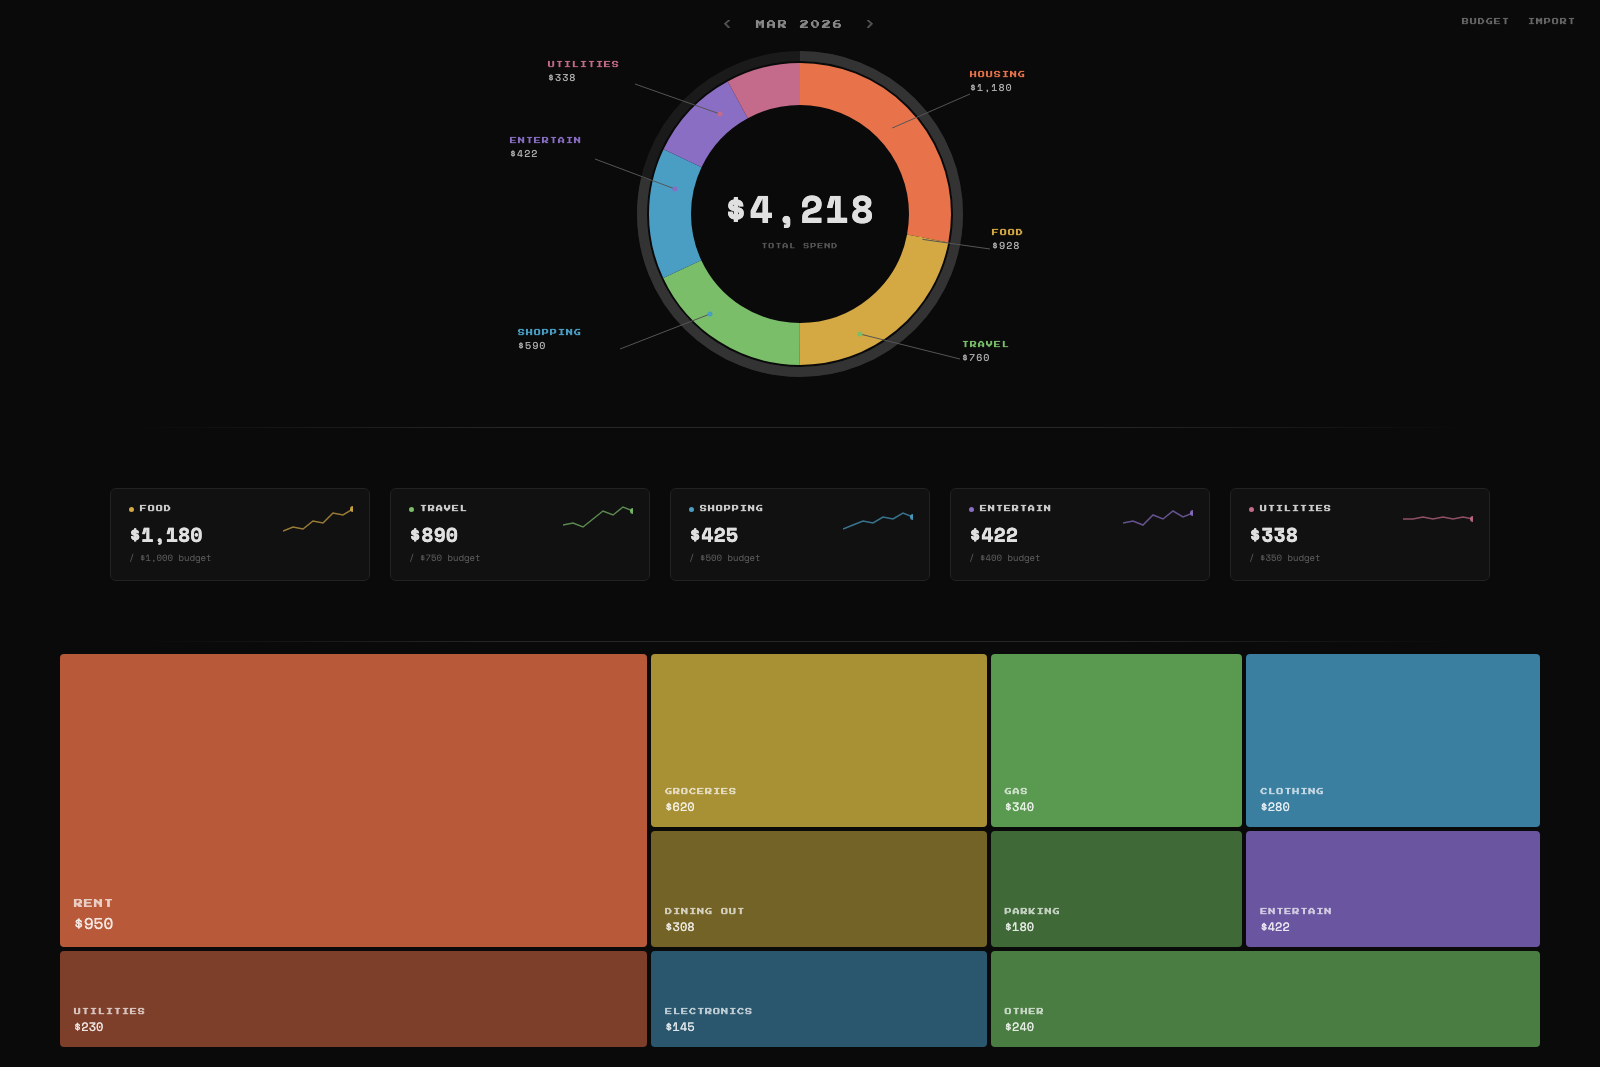
Burn Ring
Each arc in the donut represents a top-level spending category, sized proportionally to actual spend. An outer ring shows budget utilization — green where under, red where over. Hover any arc to see the category breakdown in the center. Leader lines label the largest categories without cluttering the chart.
Interactive — hover arcs to see category details
Pulse Strip
Warning cards surface only when something needs attention — a category on pace to exceed its budget, an unusual charge, or a month-over-month trend shift. Each card shows a six-month stepped sparkline with the current month highlighted.
Sparkline warning cards for pace and trend anomalies
Spatial Dashboard
The treemap fills the bottom zone with proportional rectangles for every subcategory. Small categories bucket into an expandable 'Other' tile. All three zones — burn ring, pulse strip, and treemap — render in a fixed viewport with no scrolling. Zone heights adjust dynamically based on how many warnings are active.
Subcategory treemap with drill-down to transactions
Three-zone layout fills 100vh — no scroll
Infrastructure
ClearSpend runs as a monorepo with a Vite + React frontend and a Hono API server backed by SQLite via Drizzle ORM. Custom CSV, OFX, and PDF parsers handle statements from major banks and card issuers. An auto-categorization engine applies 101 pattern-matching rules at import time. D3 renders all visualizations as raw SVG — no chart library wrapper.