Software
PortWatch
Dev ports at a glance.
Juggling six or seven dev servers across multiple projects means port collisions, zombie processes eating memory, and the occasional “why is port 3000 already in use?” interruption. The answer was always the same: run lsof, parse the output, find the PID, kill it. Every time.
PortWatch lives in the macOS menu bar and does that loop automatically every three seconds. It resolves project names from package.json, shows live CPU and memory stats per process, and lets you open, pause, or kill any server with a single click. A JSON sidecar means other tools — Claude Code, shell scripts, tmux status bars — can read the same data without re-scanning.
Process whitelist from PortWatch source. Session data from typical development workflow.
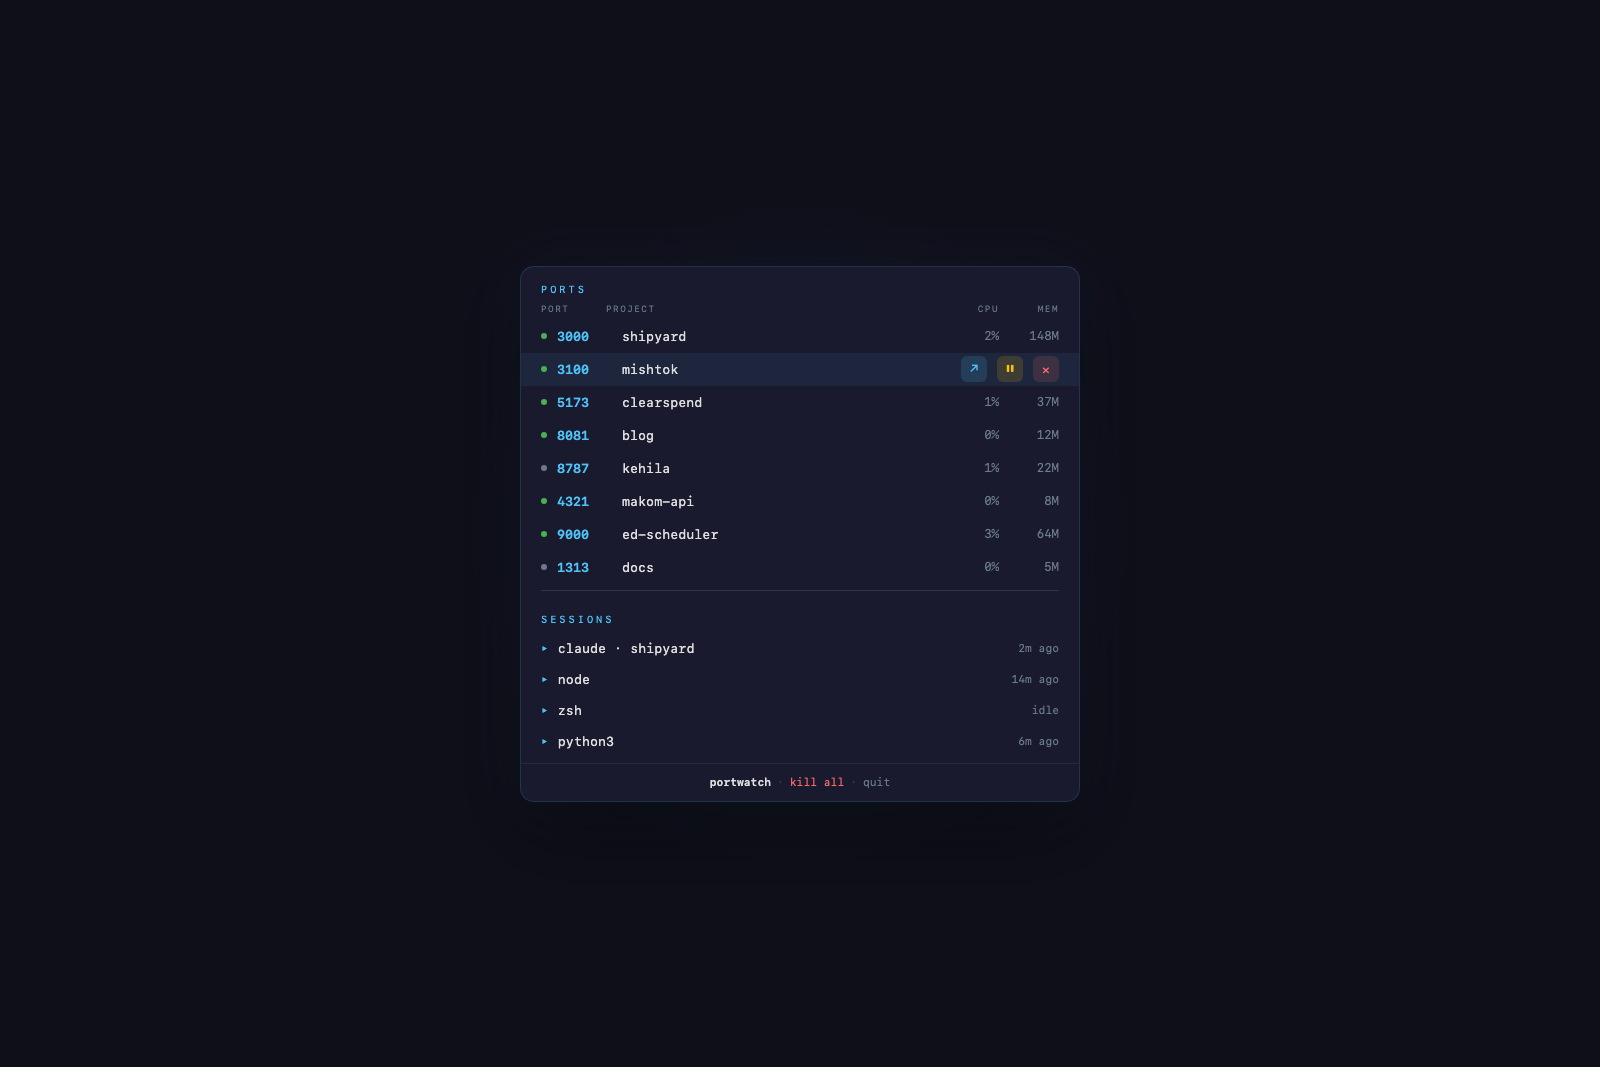
Menu Bar Popover
Every listening dev port with its project name, framework, and resource usage. Hover any row to reveal inline controls — open in browser, pause via SIGSTOP, or kill with SIGTERM.
Hover or tap a port row to reveal process controls.
Icon
Geometric antenna motif that matches the macOS menu bar icon. Signal arcs pulse on a three-second cycle — the same interval as the port scanner.
Signal arcs animate on a 3-second scan cycle.
CLI Companion
A bash script that reads the JSON sidecar for instant results when the app is running, and falls back to direct lsof scanning when it is not.
CLI output from the port-watch command.
JSON Sidecar
Every scan cycle writes atomically to ~/.port-watch/ports.json. Other tools consume the data without re-scanning — no duplicate lsof calls, no parsing overhead.
JSON sidecar and its consumers.
Built With
A Swift Package using NSStatusBar and NSPopover for the menu bar item, with SwiftUI views inside the popover. Compatible across macOS 13 through macOS 26.